Thursday, December 27, 2012

VIX picking up slowly

A higher high and higher low are in place. The middle of the channel is at around 25.


Sunday, December 9, 2012

EUR remains in a downtrend

The chart says it all really ... trading above 1.3175 would set up a test of the medium term pivot.

Thursday, October 25, 2012

UBS on the verge of breaking out of 2008 bear market trend-lline

Favour rally for the time being. Can easily go to $20, and possibly even up to $30 in the next year. Following that 2014-2016 can result in some pretty bad times.

Possible "ideal" price paths shown below.

Thursday, October 11, 2012

SPX Flat pattern similar to March 2012


Subscribers to our daily updates expected a sharp decline in wave C and the market has certainly not disappointed!  A substantial portion (or maybe all) of the wave C decline is complete. It is now worth pointing out the similarity between the current Elliott Wave Flat pattern, and the one that unfolded in March 2012.

In March, the initial ABC unfolded as expected. After that the most likely possibility was a resumption of the bull market with an impulsive advance. However, the market failed to rally. Instead it put in a small, Triangular 'X' wave ('X' means AND in EW-speak), followed by a second ABC down to complete a Double Combination to 1262.

I am not saying that this is exactly what will happen this time as well. This time we may just get the one ABC. However the pattern has been eerily similar so far so readers should stay alert for the possibility of a deeper correction. 

Tuesday, October 9, 2012

AUD/USD correction likely to accelerate

Growth concerns are mounting in Australia. As the housing market looks increasingly shaky, businesses are failing in droves. Weaker economic growth should lead to lower long-term rates. I expect weakness in the currency as capital flows out of the country, or as foreign investors in illiquid Australian investments hedge their currency risks.

Looking at the long term NEoWave pattern for AUD/USD there is a case for a correction to around 0.80. Regardless of whether you count the advance from 2009 as an Impulse or a Double Combination, the advance needs to be corrected. Targets for the correction range from 0.90 down to 0.80. Stops can be placed at 1.0612.

Long-term puts on ETF FXA can be used to short this currency pair. Professional Investors may consider buying long-term Australian Government Bond Futures in anticipation of lower long-term rates.

Monday, October 8, 2012

Elliott Wave Technical Analysis Report for Oct 01, 2012

Please find a link below to the Daily Update sent out to subscribers on Oct 1, 2012. Visit www.damarlaconsulting.com for information on how to receive these reports on a daily basis.

Elliott Wave Technical Analysis Report for Oct 01, 2012

Monday, October 1, 2012

Elliott Wave Technical Analysis Report for Sept 24

This Daily Update was sent out to subscribers on Sept 24, 2012. Visit www.damarlaconsulting.com for information on how to receive these reports on a daily basis.

Elliott Wave Technical Analysis Report for Sept 24, 2012

Friday, August 24, 2012

Gold retesting top of the consolidation channel

Gold is at a crucial pivot level between bear and bull outcomes. Daily RSI is overbought enough to call for a short-term correction here.

Gold Bears want to see Gold fail below the upper trend-line of the year-old bear channel/bull-flag/consolidation, below 1675-80.  Bearish counts in Blue and Red target new lows that range anywhere from 1490 down to the 1300s. 

Gold Bulls want to see continuation of the persistent impulsive rise with short, shallow pullbacks. A possible bullish wave-count is shown in Black with wave E marking the last leg of an ABCDE wave (4) consolidation from last year's blow-off top (unlikely below 1592.1). An alternate bullish count in Grey requires a retest of the 1525 lows as wave 'c'.


Saturday, August 11, 2012

Gold medium term wave-counts

The blow-off top in 2011 started a correction that has lasted almost a year now. For the past few months Gold has been stuck in a slowly-contracting trading range between 1525 and 1642.

To end the correction from 1900, Gold needs to rally above 1800, where it has failed twice. But first it needs to break out of the Red descending channel

An impulsive rise that achieves a weekly close above the 1670-75 area (December Future) is needed to avert  a continued decline. A possible bullish wave-count is shown in the chart below to support this scenario. 

If a sharp decline is seen close to the upper channel boundary (similar to what happened after the end of wave D), we risk a further decline to 1480-90, or even lower to the channel base at 1300-1325 (both 4th waves of lower degrees).

Gold Dec Future Daily (3 years) 

A bullish wave-count in which Gold is ready to rally is shown in BLACK below. Too early if below 1585. Wrong below 1550
A bearish wave-count shows wave C extending lower towards 1480-90 or 1300-25 (depending on where wave B ends). Unlikely above 1575.

Sunday, July 15, 2012

India Sensex to top around 19,000: Vivek Patil

Vivek Patil has been doing analysis on the SENSEX since 1997-98. I find his NEowave analysis very thorough and well researched. His latest update is here: http://content.icicidirect.com/ULFiles/UploadFile_20127993737.asp. Its quite a long and comprehensive report. Bottom line, he is suggesting that the current rally will run out of steam somewhere around the 19,000 mark in the next few of weeks. From there it could fall to 15,000 or below. 

If his forecast is correct, it could lead to similar patterns in other Asian indices. Some charts from his updates are shown below. They zoom in from a multi-decade picture to the short term chart (shown in the end). 

Exhibit 1. MULTI-YEAR FORECAST (since 1979)
 
The sell-off that started in Jan 2008 marked the beginning of a multi-year consolidation. The 2008 bear market was wave 'a'. It was completely retraced by wave 'b'. Wave 'c' completed recently and now wave 'd' is forming. This will be followed by a sell-off in wave 'e' that will end below the recent wave 'c' bottom (around 15,200). Following that will be a rally in wave 'f' that will make new highs. Finally, the consolidation that started in Jan 2008 will end in a sharp selloff in wave 'g'. Form here a new bull market is likely to be born.


Exhibit 2. A detailed wave-count for the Bull Market since 2003


Exhibit 3: Previous year's bear market wave circle-C is now being partially retraced by wave circle-D

Wave circle-D is forming as an a-b-c "Flat". Usually in a Flat wave c = wave a ... hence the target of around 19,000


Wednesday, June 20, 2012

GOLD - short term Elliott Wave ideas

The three counts that I am monitoring are presented (in decreasing order of likelihood)... Black - Double zig-zag; Red - (b) wave triangle; and Green - impulsive 

All bets are off if it breaks below "multi-month support"  ($1525-ish)


Tuesday, May 29, 2012

Dollar Index faces significant test

Last month's rapid EUR decline has brought the Dollar index up against a significant trendline stretching back 11 years. Chances are we will get a reaction here. 

If DX slices through this level, the next attraction is the 88/90 area (previous peaks from the 2008 crash & Summer 2010 Euro-to-zero fears).

Sunday, May 20, 2012

SPX Special Update

SPX touched a low of 1291.98 on Friday. This overlaps with the October 2011 high of 1292.66. 
  • Just below us is the crucial Dec 2011 high at 1267.07. Breaking below this has major structural implications.
  • IF SPX trades below 1267.07, I will be forced to mark the advance from the Dec 2011 low as (a)-(b)-1-2-3-4-C (see chart below); instead of current (1)-(2)-1-2-3-4-(3)-(a)-(b)-(4)-(5) count (not shown) 

It is NOT A GIVEN that we will get down to 1267.07. Reasons this may not happen are:
  • There is EXTREME bearishness, while the market is down only 9% from recent highs
  • This is more likely the sign of a short-term PANIC, than the beginning of a bear market
  • We dropped to 6% bulls on the Daily Sentiment Index for SPX on Friday. This is close to the 4% level we have seen for previous panic lows.
  • Daily RSI is deeply oversold - LOWER than Mar 2009; and almost as low as Oct 2008
  • Channel support from March 2009

BOTTOM LINE 
  • Dropping only 28 points from here will change the MEDIUM-TERM structure of the market. Stay alert for the possibility that we dip below 1267.07 before the upcoming oversold rally.
  • Yes, the market may crash but NO ONE can tell you that BEFORE it happens. I wouldn't stay short a market with only 6% bulls and a deeply oversold Daily RSI


NEW SPX count IF we trade BELOW 1267.07 (MEDIUM TERM)


NEW SPX count IF we trade BELOW 1267.07 (SHORT TERM alternate)


Wednesday, May 16, 2012

SIlver at pivot level

We are near support @  26.3 from the Ascending Channel and Previous Lows. Breaking below would activate a Head & Shoulders pattern leading to a steep decline towards 20 / 21.6.

NDX near channel support and 38.2% retracement

A good spot to find support and rally in wave (v). Daily RSI getting to oversold to levels. Only lower in Oct 2008 and in the 2011 panic.

Definitely the strongest looking of all the major US indices.


Tuesday, May 15, 2012

Precious Metals Mining on Sale

A "historic buying opportunity" keeps getting better, but I wonder where the mining stocks bottom ???

Senior Gold Miners ETF


Silver Miners ETF


Junior Gold Miners ETF


Wednesday, May 9, 2012

SPX Update 2012-05-09

See Previous update here.

A Flat a-b-c correction for wave (4) alternates nicely with the sharper and deeper wave (2). Wave (4) has done enough to count as completed, and if so, we should now see a move to 1440 or 1510 in wave (5). Clearing potential resistance levels at 1375, 1390 and 1400 provides increasing confidence in this scenario. Wave (4) may also evolve into a more complex correction so we will keep an eye out for that.

An alternate count is presented for the bears. It calls for a weak corrective bounce followed by an impulsive break below recent lows. However, I wouldn’t bet on it in the face of any rise above 1400.


Crude Oil Update 2012-05-09

If the a-b-c decline from $110 is complete, we may have formed wave d of a Contracting Triangle with Reverse Alternation (BROWN). In Contracting Triangles a < c < e. In normal alternation b > d, which gives us a familiar contracting shape. However in reverse alternation b < d. Note that wave c of a triangle cannot be the shortest, capping wave e at $114.12. Wave e is 0.618 * wave c, at around $107. Declining below $92.5 would call this scenario into question.


Tuesday, April 24, 2012

AAPL update

With the blowout earnings  and the after-market jump in shares, the recent 12% correction becomes a 3 wave affair.

Now I think wave (v) of the advance from Nov 2011 is underway in AAPL. Whether that advance is wave 5 or wave 3 (alt count) remains to be seen. Only a decline below 550 will invite reassessment.


AAPL Longer term count


Tuesday, April 17, 2012

Dr. Copper looks bearish

Could Dr. Copper be signalling a Chinese hard-landing? Here is a bearish looking chart with a massive Head & Shoulders topping pattern.

A NEoWave Contracting Triangle (A > C > E) with Reverse Alternation (D > B instead of the usual B > D) is shown. 

Alternative counts like a  multi-year Contracting Triangle or Ending Diagonal are also possible.

Wednesday, April 11, 2012

SPX Update - 2012/04/11

On Tuesday market closed at 1357, the Fibonacci 78.6% retracement of the uptrend from wave 4. Below this level, the Ending Diagonal count to 1440 is no longer favoured. However it can only be eliminated below the wave 4 low at 1340.

SPX's clean break below 1375 suggests that wave (4) may have begun. A backtest and subsequent rejection of the 1375 level will strengthen the case that wave (3) has ended.

Wave (4) can retrace up to 50% of wave (3) to around 1300/1310. More likely it will find support at the wave 4 low of 1340. For alternation with wave (2) it will most likely take the form of a Triangle, Flat or combination.


For clarity, here is the Ending Diagonal count:


Saturday, March 31, 2012

Gold & gold stocks update

Gold and Gold Stocks are now seeing extreme investor pessimism & a host of technical data is pointing to an extreme in undervaluation and sentiment. A good update by Pater Tanenbrarum - http://www.acting-man.com/?p=15935

This is not to say we are at an imminent turning point, only that one could be very close. I would be surprised to see Gold staying below the recent low at 1625 for very long. Upside resistance is at 1675, 1700 and then the (red) downtrend channel at 1750.


Previous Update: http://elliottwavecounts.blogspot.co.uk/2012/02/golds-downtrend-channel-asserts-itself.html

Monday, March 26, 2012

SPX update 2012-03-26

I see this correction as the first of 2 significant corrections in the next up-leg of this uncompromisingly bullish market. The uptrend should continue over the next couple of months. SPX has already climbed 300 points since the End of the Panic of 2011. There are a good 40 or 110 SPX points left in this bull market before a significant correction. 

Two project targets for this bull market move are 1440 and 1510. These are based on previous significant support/resistance levels and  Fibonacci Extensions. 

The main scenario has a target of 1510. A wave-count is presented in the SPX futures chart below. In this scenario wave 5 of (3) is extended. The exact internal subdivisions will continue be a uncertain until towards the end of the move. 


In a less bullish scenario the current wave ends in an Ending Diagonal at 1440. This scenario is not shown on the chart. We are already some way through the Ending Diagonal if this is the case. This view is supported by the negative divergence in the RSI. In this view wave 3 of (5) is extended


Thursday, March 8, 2012

SPX Update 2012/03/09


Yesterday's rally above 1366 leaves the decline from the wave (3) high as a corrective structure. Crucially, the first wave of the decline stopped at 1339, falling short of the 1337 level required to confirm the end of wave (3). For now this keeps alternate, more bullish counts alive. I will elaborate on those if the market makes new highs in the next couple of days. Overlap with the wave 3 high at 1333 would have eliminated several of these.

For now, I expect resistance at 1375 to continue to contain the advance ... not enough time has passed in wave (4) for the correction to be complete. I tentatively label the first decline to 1339 as sub-wave 'a' of (4). The next few days should produce a choppy overlapping sub-wave 'b' in the 1139-1375 range.


Thursday, March 1, 2012

SPX Topping

The Ending Diagonal has one small up-leg remaining that should make a minor high in the 1375- 1380 range. This should be followed by a sharp initial decline that should retrace to the the base of the Ending Diagonal (around 1335 -1340). 


The Ending Diagonal completes wave (3) which began in mid-December. Wave (4) can retrace all the way to 1267. A 1300 target is more likely.


Bonds look ready to rally in the "f" wave of a Diametric. Notice the symmetry in shape between waves "c" and "e" - they appear to be mirror images of each other, suggesting that wave "f" should resemble wave "b"


I am curious to see how Crude Oil will react. A clear inverse Head & Shoulder pattern has established itself that targets $130. 

However if stocks slump  crude could move the other way as well. Resistance is at the top channel line  - that is where I would expect a reaction.

Wednesday, February 29, 2012

Gold's downtrend channel asserts itself

The strength of the reaction from the top of Gold's downtrend channel indicates that another leg down remains in Gold's consolidation. Note the rapidity of the decline, and the fact that Gold closed below the previous up-leg's final segment. For those who missed this year's rally, Gold should be available for purchase at significantly better prices. It remains an excellent hedge against poor stewardship of the economy by governments and central bank eggheads. A move to the $1625 area is very likely in the short term. If my tentative wave count is correct, the target for wave C is in the 1400-1500 range. 

Saturday, February 25, 2012

Liquidity-driven euphoria shifting from Stocks to Commodities

In a situation eerily reminiscent of early 2008, the new-found flood of liquidity appears to have found its way into the energy complex. Liquidity-driven trends need a story. In early 2008, it was "exploding M3 money supply". Today it is the Iran war story that speculators seem to have latched-on to. European Sovereigns/Financials/Stocks, and US Stocks have all flattened or turned down as Crude and WTI surge. Silver and Gold remain the major outperformers YTD but the rest of commodities - most notably oil is catching up very fast having overtaken stocks this week. 

From Zerohedge


As John Burbank of Passport Capital described, its possible that the oil complex does not stop until the US economy's back is broken. It would be difficult for the Fed to enter a tightening cycle in an election year, especially since they have clearly broadcast a loose monetary stance until 2014. Similar to early 2008, commodities (led by crude oil) can have a blow-off move that lasts for a few quarters and pushes marginal consumers over the edge, thus tanking the recovery. In 2008 high oil prices probably sparked the financial crises by pushing over-leveraged borrowers into default. This effect is qualitatively different from blow-off moves in say, precious metals, which are driven by sovereign & financial worries but don't affect the real US economy. Or high food prices, which are more of an issue for emerging markets than the US.


With LTRO 2 already priced in, and the Fed having been handed the baton of printing by the rest of the world's central banks this weekend at the G20 meetings, we suspect the liquidity will remain pumping in Oil until the CME steps in with margin hikes or some major earnings disappointment.


Technicals

In the Weekly chart below, there is a clear breakout. It is now very likely that the breakout surpasses the 2011 high at 115 and goes on to target the upper trendline of an Expanding Triangle. A price equal to the 2008 high at around 150 is possible, and maybe even higher. Any escalation of the Iran situation will just add fuel to the speculative fire. Weekly RSI is nowhere near overbought, indicating that the bulk of the move lies ahead of us. MACD too has plenty of room to run.


Thursday, February 23, 2012

Platinum

Platinum has recently under-performed Gold. Historically Platinum prices have been at 50% to 100% premium over gold. However, more recently, the price of Platinum has fallen below Gold due to growth worries. During last year's correction Platinum found support at the 2007 highs around the $1350 area while Gold found support at $1500. That correction is clearly in 3 waves and the reversal of that correction is looking impulsive.

Platinum is is looking good for an extended run here. I would start small & add on corrections.

Friday, February 17, 2012

SPX Update -17/02/2012


The ideal projection for wave (v) of 5 is complete. It is now highly likely that the move that started in mid-December will correct/reverse. Price must lead the way, better not get ahead of ourselves. 

First, we need to close below the 1335-1340 area, preferably with a sharp move (gap down on Mon/Tue). That will signify that wave 5 is being corrected/reversed. 

If you are lucky to be positioned long since December do not exit before this happens. Failure to close below 1335 can mean that the fifth wave is sub-dividing, or that the wavecount needs to be revised into something more bullish.

Second, we need to close below 1300 in less than 2 weeks to confirm that the move since mid-December is being corrected/reversed.


Wednesday, February 15, 2012

Sensex Update 15/2/2012

The wave-count for the Sensex is not very clear at the moment. The one shown below is a guess and probably will need to be changed.

However the technical indicators are fairly strongly suggesting an imminent correction. We are at a resistance level that has help twice previously and are also at to top of the shallowest possible downtrend channel. 

RSI is overbought and negatively diverging suggesting the current move will end soon. MACD is on the verge of giving a sell signal.

All we need is for price to breakdown and confirm the reversal.

SPX update 15/2/2012

Things are getting interesting with the first real sign of weakness observed in the parabolic move for AAPL. The price has crumbled below $500. Let's see if dip buyers step in and try to keep its rally going. Wave theory isn't going to very helpful here.

The short-term count below suggests another move higher towards 1362 to complete the wave that started in mid-December. The last wave remaining would be the (v)th of 5th.

Immediate support is in the 1335 area. Below that would be a short-term reversal. 

After that, a quick move below 1300 (in less than 2 weeks) would be required to confirm the end of the move since mid-December. Otherwise a continuation is more likely.


Thursday, February 9, 2012

Could AAPL just have topped?

It takes a very brave man to call a top for this stock, but I think it might just have ended a major move which started in early 2009.  Alternatively it might only correct the impulse from the April 2010 flash-crash. Another alternative is that it may have another iv-v to go in its Expanding Triangle, and the current move may just be iii of the Expanding Triangle.

Either way, any overlap with 420 would confirm that the latest advance is of a terminal nature, and that we are seeing "panic" buying.

I would need to see a sharp reversal to confirm this count, but I cannot see the current breakout turning into a 3rd wave given how overbought it is at the moment.

This is not a comment on the fundamentals for AAPl. It remains a phenomenally innovative and profitable company. Its growth rate, given its current size it simply unbelievable. However, keep in mind that excellent fundamentals could not stop it from correcting to 85 from 200 during the Financial Crises.

Tuesday, February 7, 2012

SPX - a new short term alternative

I started from a clean slate, trying to count all the waves on the ES (SPX futures) since mid-December.

One of the things that bothered me about the impulsive counts so far is the lack of a proper impulsive, powerful move during this entire period.

One possible way to interpret this rather difficult-to-count period has surprised me. It could be that the period until Jan 26th was a long wave 1. That would put us in the initial stages of a 3rd wave. With most EW analysts focused on completion of bearish long-term counts, this wave count could surprise people and provide the acceleration at the "point-of-recognition" that has been missing so far.

Although my Q1 2012 Forecast calls for an upcoming consolidation period, I think its important to track this as a possible wave count as a valid possibility if the next correction doesn't go beneath 1300-1315.

Sunday, February 5, 2012

SPX Q1 2012 forecast

After catching the End of the Panic of 2011 I have been nervously carrying a bullish bias with minor modifications to the wave counts for almost 8 months now. It has been difficult psychologically. The market truly has climbed a wall of worry during this period, as it has encountered stiff resistance with a very negative macro background.

Over the past 8 months various technical resistance points has been methodically and decisively overcome. While staying alert to bearish possibilities, all this while my main count has remained bullish

Technical analysts must always maintain respect for the price action and allow the wave structures to inform their bias. In that spirit, note that last week's rally vaulted over the trendline connecting the Jan 2008 and April 2011 tops. Structurally, this is a very bullish event that is difficult to ignore. Coupled with the fact that the Nasdaq and DJIA have been "leading"  this advance, and that the Nasdaq already taken out both the previous highs, I can now confidently focus to the most bullish of the three bullish counts that I have been carrying in 2012.


In the chart above I layout a roadmap for the rest of Q1 2012. I think the market will now start to digest the gains of the past month. I expect the month long wave (3) to complete its internal wave 3 soon and correct in wave 4. In doing so it must stay above the wave 1 extreme at 1285. Wave (3) should then complete with a rally in wave 5 to challenge the 2011 highs at 1370. Beyond this we should see a wave (4) correction and another rally in wave (5). 

The internal structure of these upcoming waves is too far out to be predictable. 

For the next quarter I expect to see support in the 1285-1300 range, and resistance in the 1350-1375 range. The overall structure should be sideways, perhaps with a slight upward bias. 

I also will keep an eye on the VIX as it finds support in the "Greed" zone. Any visits to the "Fear" zone should provide buying opportunities for the SPX.


Friday, January 27, 2012

SPX update - 2012-01-27

The market has scored a "direct hit" on the incredibly important trendline joining the Jan 2008 and May 2011 tops. It is a bit surreal how many times these trend-lines draw a reaction, but it is what it is.

Initial support is around 1296. Failure to vault over the blue trendline, coupled with the overbought condition can easily lead to significant correction develop in this area.

Tuesday, January 24, 2012

US 30yr Bond update: 2012-01-24


SPX update: 2012-01-24

Here is an update on the bullish Elliott Wave counts posted here a couple of days ago. 

Although SPX could have put a top in yesterday, and has opened slightly lower today, I don't see enough divergence on technical indicators to confirm a top. I think the market has the potential for one more rally, but technicals are overbought and the market is ripe for a correction. Tom Demark (a good market timer) predicted a top today on Bloomberg TV. 

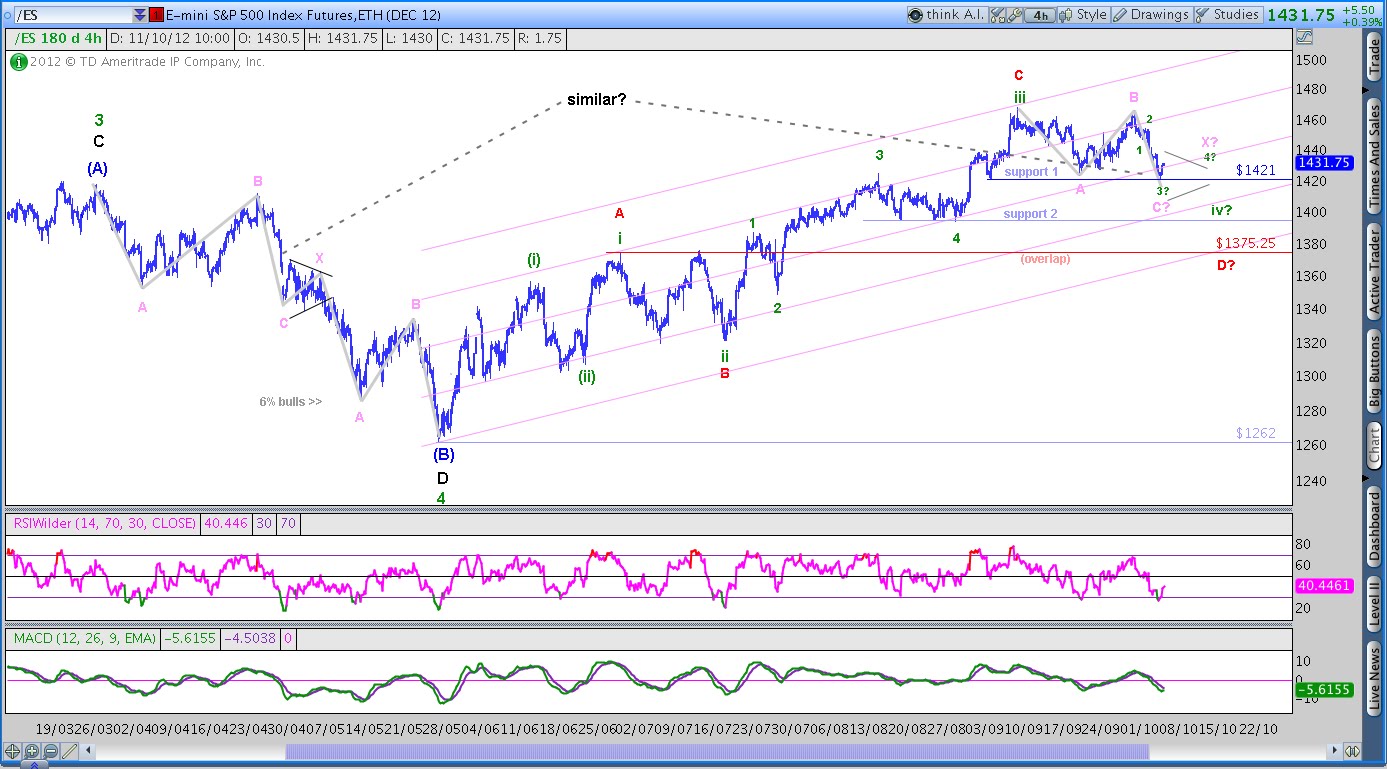
The blue trend-line in the chart below connects the Jan 2008 and April 2011 tops and it should offer important resistance to contain 2 out of 3 counts that are in focus (on a closing basis). In the chart below these two higher probability counts are marked in RED and GREEN. 

The RED count completes wave (3) of III. Wave (4) should not overlap with wave (1) so this count would be invalid below 1266.73
The GREEN count completes wave 1 of (3). This count allow a correction all the way to 1202, though in practice in should find support around 1260

If the market vaults over the1330-1340 area contained by the blue trendline, we will shift focus on the count in YELLOW which  would put us in an incredibly bullish wave (iii) of 3 of (3) of III. Such waves do occur from overbought conditions and markets stay overbought for a while as third waves accelerate. 


There is a potential for a VIX reversal here. It is at support line since April 2011. RSI shows a positive divergence. A complete Elliott Wave pattern (Ending Diagonal) is seen. Closing above 24 will be positive for VIX and bearish for the SPX.

Sunday, January 22, 2012

SENSEX overbought at resistance

Overbought conditions exist in most markets after a great start in January. In the previous Sensex update I pointed out the positive divergence in RSI and the possibility of a long term bottom. Now the market is overbought and at channel resistance. A different wave structure allows the possibility of a 'c' wave lower to complete a Double zig-zag correction. This move could fill the election gap from 2009.

Note that I have used an India ETF (INP), not the Sensex itself in the chart below.

Blog Archive