Saturday, December 14, 2013

Sunday, December 1, 2013

OEW count (alternate take)

A good weekend update by Tony Caldaro's OEW group is posted here: http://caldaro.wordpress.com/2013/11/30/weekend-update-425/

My take on the OEW impulsive count on the Dow is below. Ignore the implications of a higher degree due to the labeling - it doesn't mean anything in my chart.

The modification I have made is to provide for alternation between waves 2 and 4. An Irregular Flat 4 indicates that the uptrend's momentum is strong, and that wave 5 will not be weak and truncated (already confirmed).

A similar count in the SPX has an Irregular Triangle instead of an Irregular Flat


Wednesday, October 9, 2013

GLD at top of declining channel

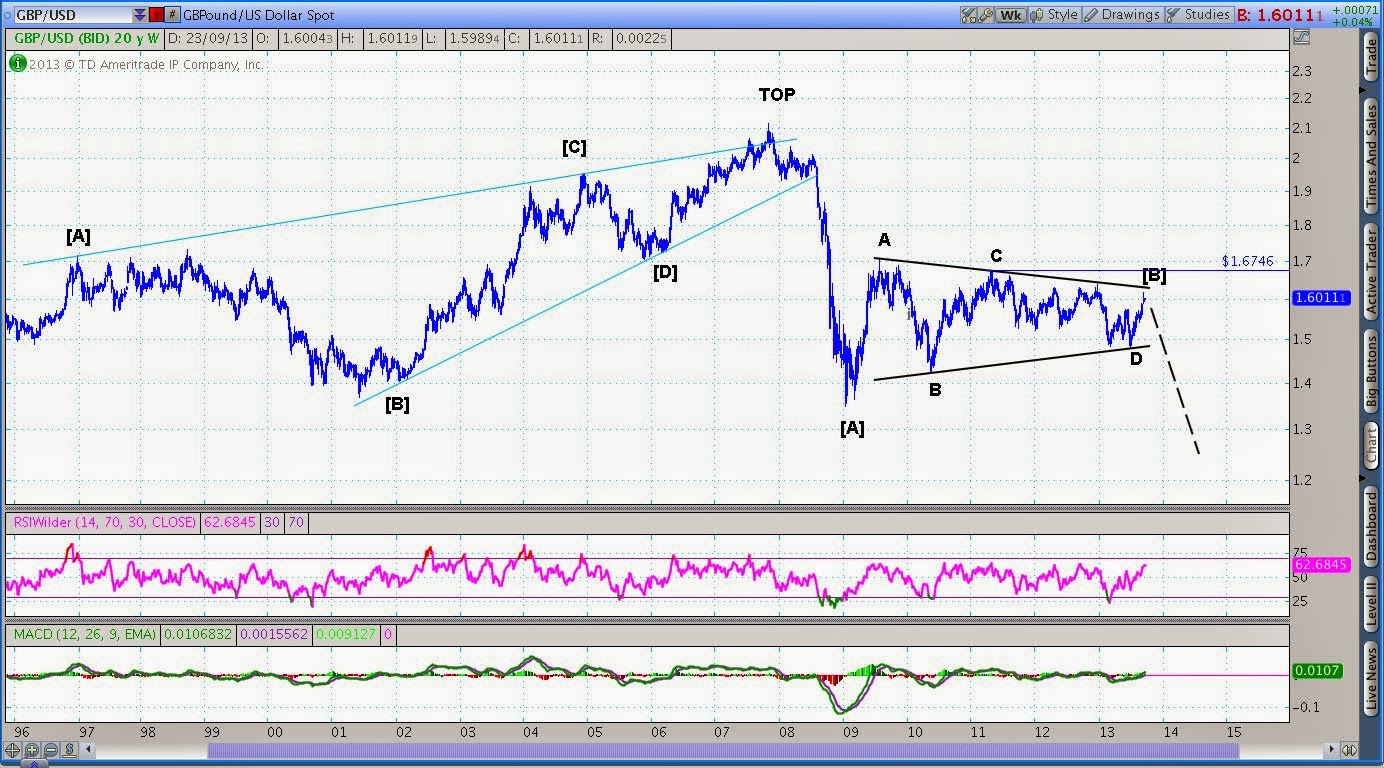
The decline from 137.5 peak in August is best counted as a corrective Double Zig-Zag (abc-x-abc) with the last declining "c" leg yet to unfold. The 

We are now at the top of the declining channel. If the top rail acts as a resistance we should see an impulsive decline. Support come in around 120 from the longer-term bear flag.

Wednesday, October 2, 2013

Tesla Downgrade

Appears to be the end of wave (3) and a good time to short this bubble stock!


Friday, September 27, 2013

Inflation Expectations and the TIP/TLT ratio

The ratio of ETFs TIP &TLT forms a useful inflation barometer. 

During the deflation scare of 2008 TIP under-performed TLT. The initial QE rounds resulted in a reflation that led to heightened inflation expectations. 

However since mid-2011 inflation expectations have cooled off. TLT has been in a downtrend channel relative to TIP starting with a sharp decline, and followed by a long consolidation. 

Now this ratio is in a resistance area defined by previous levels and at the top of a downtrend channel. A renewed decline from here would put pressure on inflation trades - Gold, EM, miners, banks, etc.

A breakout would be a very interesting surprise, given the shrinking effectiveness of the QE measures in stoking inflation expectations.


Sunday, September 22, 2013

GBP/USD Triangle projects a decline to 1.25, stop at 1.6746

A Symmetrical Triangle in GBP/USD has meandered its way to completion over 5 years. A decline to 1.25 is projected here. Wrong above 1.6746.


Wednesday, August 14, 2013

EUR/GBP breaks below uptrend-line


  • A Double Zig-zag correction appears to be unfolding since the 2009 top. 
  • Short EUR/GBP with a stop at 0.8769 targeting 0.75. 
  • Additional confidence below 0.8164.


Sunday, June 16, 2013

Currencies Update

Dollar Index at channel support. Likely paths for rally shown below. Also see contracting Weekly RSI range.


EUR/USD has multiple resistance lines just above. Good spot to fade.


Symmetrical triangle on GBP/USD. A break below wave D @ 1.4833 to confirm a decline along the projected path. 


EUR/GBP has the makings of a Double Zig-Zag which should decline to new lows (0.75). A decline below 0.8164 to confirm. The decline should remain contained within the declining channel.


USD/JPY resistance at 100-105 worked. Now looking for a possible Triangle wave 4. Wave 4 must not retrace past 87.36, otherwise the impulsive count is called into question.


The AUD/USD weakness projected last year has finally materialised. Oversold Weekly RSI suggests that this pair may get a respite for a month or two before resuming a decline.


Saturday, June 1, 2013

SPX Update 2013/06/01

A corrective wave-count below suggests that the SPX rally from Nov 2012 is over. A correction below 1470 before a new high will strongly suggest that the nature of the entire rally from 2009 is corrective. One way for the rally to terminate would be an Expanding Diagonal (ABCDE) as show below.

Monday, May 27, 2013

Silver at long-term channel support

  • Last week opened with a "washout" low in the early hours that nearly dipped to $20.
  • Price was neatly supported by the lower boundary of the longer term channel from 1999 - see longer term chart below. 
  • Now with slight positive divergence on the Daily RSI there is the potential for a bounce into the high twenties, and maybe more if the descending blue channel is taken out.
  • For now, a close above $23.85 would be supportive of this view.


Sunday, May 26, 2013

Crude Oil getting ready to trend

Compressed Bollinger Bands indicate an imminent breakout from of the narrowing range. Support around $85 and resistance around $100.


Saturday, February 23, 2013

HUI approaching important support

The chart below shows channeling in mining shares for the rally that began in 2000. Now we are approaching the bottom rail of the channel, along with the 61.8% retracement of the post 2008 rally. Sentiment is in the pits and weekly RSI is oversold. If the channel holds, this maybe the perfect spot to load up on choice Precious Metal mining shares.