Wednesday, March 20, 2013
Saturday, February 23, 2013
HUI approaching important support
The chart below shows channeling in mining shares for the rally that began in 2000. Now we are approaching the bottom rail of the channel, along with the 61.8% retracement of the post 2008 rally. Sentiment is in the pits and weekly RSI is oversold. If the channel holds, this maybe the perfect spot to load up on choice Precious Metal mining shares.

Thursday, December 27, 2012
Sunday, December 9, 2012
Thursday, October 25, 2012
Thursday, October 11, 2012
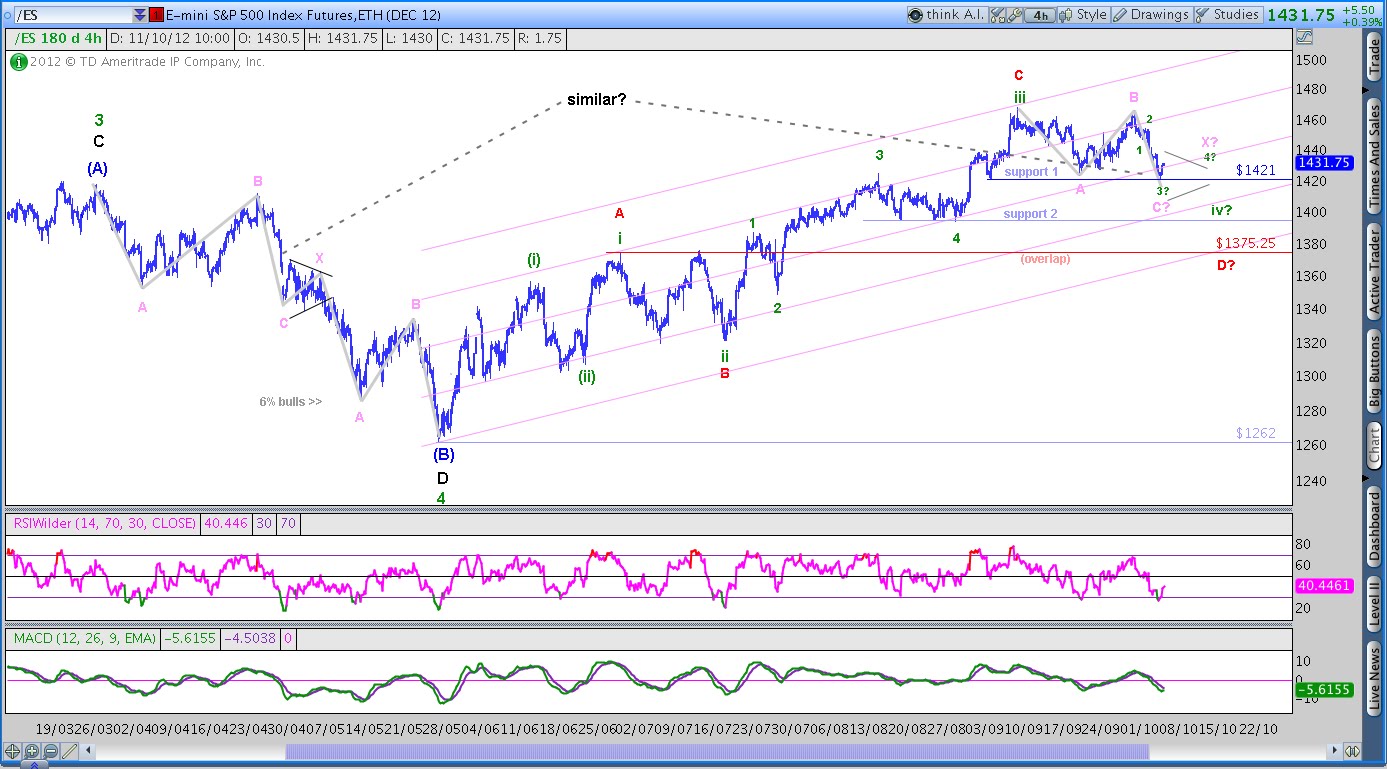
SPX Flat pattern similar to March 2012
Subscribers to our daily updates expected a sharp decline in wave C and the market has certainly not disappointed! A substantial portion (or maybe all) of the wave C decline is complete. It is now worth pointing out the similarity between the current Elliott Wave Flat pattern, and the one that unfolded in March 2012.
In March, the initial ABC unfolded as expected. After that the most likely possibility was a resumption of the bull market with an impulsive advance. However, the market failed to rally. Instead it put in a small, Triangular 'X' wave ('X' means AND in EW-speak), followed by a second ABC down to complete a Double Combination to 1262.
I am not saying that this is exactly what will happen this time as well. This time we may just get the one ABC. However the pattern has been eerily similar so far so readers should stay alert for the possibility of a deeper correction.
Tuesday, October 9, 2012
AUD/USD correction likely to accelerate
Growth concerns are mounting in Australia. As the housing market looks increasingly shaky, businesses are failing in droves. Weaker economic growth should lead to lower long-term rates. I expect weakness in the currency as capital flows out of the country, or as foreign investors in illiquid Australian investments hedge their currency risks.
Looking at the long term NEoWave pattern for AUD/USD there is a case for a correction to around 0.80. Regardless of whether you count the advance from 2009 as an Impulse or a Double Combination, the advance needs to be corrected. Targets for the correction range from 0.90 down to 0.80. Stops can be placed at 1.0612.
Long-term puts on ETF FXA can be used to short this currency pair. Professional Investors may consider buying long-term Australian Government Bond Futures in anticipation of lower long-term rates.
Subscribe to:
Posts (Atom)


