Sunday, July 15, 2012

India Sensex to top around 19,000: Vivek Patil

Vivek Patil has been doing analysis on the SENSEX since 1997-98. I find his NEowave analysis very thorough and well researched. His latest update is here: http://content.icicidirect.com/ULFiles/UploadFile_20127993737.asp. Its quite a long and comprehensive report. Bottom line, he is suggesting that the current rally will run out of steam somewhere around the 19,000 mark in the next few of weeks. From there it could fall to 15,000 or below. 

If his forecast is correct, it could lead to similar patterns in other Asian indices. Some charts from his updates are shown below. They zoom in from a multi-decade picture to the short term chart (shown in the end). 

Exhibit 1. MULTI-YEAR FORECAST (since 1979)
 
The sell-off that started in Jan 2008 marked the beginning of a multi-year consolidation. The 2008 bear market was wave 'a'. It was completely retraced by wave 'b'. Wave 'c' completed recently and now wave 'd' is forming. This will be followed by a sell-off in wave 'e' that will end below the recent wave 'c' bottom (around 15,200). Following that will be a rally in wave 'f' that will make new highs. Finally, the consolidation that started in Jan 2008 will end in a sharp selloff in wave 'g'. Form here a new bull market is likely to be born.


Exhibit 2. A detailed wave-count for the Bull Market since 2003


Exhibit 3: Previous year's bear market wave circle-C is now being partially retraced by wave circle-D

Wave circle-D is forming as an a-b-c "Flat". Usually in a Flat wave c = wave a ... hence the target of around 19,000


Wednesday, June 20, 2012

GOLD - short term Elliott Wave ideas

The three counts that I am monitoring are presented (in decreasing order of likelihood)... Black - Double zig-zag; Red - (b) wave triangle; and Green - impulsive 

All bets are off if it breaks below "multi-month support"  ($1525-ish)


Tuesday, May 29, 2012

Dollar Index faces significant test

Last month's rapid EUR decline has brought the Dollar index up against a significant trendline stretching back 11 years. Chances are we will get a reaction here. 

If DX slices through this level, the next attraction is the 88/90 area (previous peaks from the 2008 crash & Summer 2010 Euro-to-zero fears).

Sunday, May 20, 2012

SPX Special Update

SPX touched a low of 1291.98 on Friday. This overlaps with the October 2011 high of 1292.66. 
  • Just below us is the crucial Dec 2011 high at 1267.07. Breaking below this has major structural implications.
  • IF SPX trades below 1267.07, I will be forced to mark the advance from the Dec 2011 low as (a)-(b)-1-2-3-4-C (see chart below); instead of current (1)-(2)-1-2-3-4-(3)-(a)-(b)-(4)-(5) count (not shown) 

It is NOT A GIVEN that we will get down to 1267.07. Reasons this may not happen are:
  • There is EXTREME bearishness, while the market is down only 9% from recent highs
  • This is more likely the sign of a short-term PANIC, than the beginning of a bear market
  • We dropped to 6% bulls on the Daily Sentiment Index for SPX on Friday. This is close to the 4% level we have seen for previous panic lows.
  • Daily RSI is deeply oversold - LOWER than Mar 2009; and almost as low as Oct 2008
  • Channel support from March 2009

BOTTOM LINE 
  • Dropping only 28 points from here will change the MEDIUM-TERM structure of the market. Stay alert for the possibility that we dip below 1267.07 before the upcoming oversold rally.
  • Yes, the market may crash but NO ONE can tell you that BEFORE it happens. I wouldn't stay short a market with only 6% bulls and a deeply oversold Daily RSI


NEW SPX count IF we trade BELOW 1267.07 (MEDIUM TERM)


NEW SPX count IF we trade BELOW 1267.07 (SHORT TERM alternate)


Wednesday, May 16, 2012

SIlver at pivot level

We are near support @  26.3 from the Ascending Channel and Previous Lows. Breaking below would activate a Head & Shoulders pattern leading to a steep decline towards 20 / 21.6.

NDX near channel support and 38.2% retracement

A good spot to find support and rally in wave (v). Daily RSI getting to oversold to levels. Only lower in Oct 2008 and in the 2011 panic.

Definitely the strongest looking of all the major US indices.


Tuesday, May 15, 2012

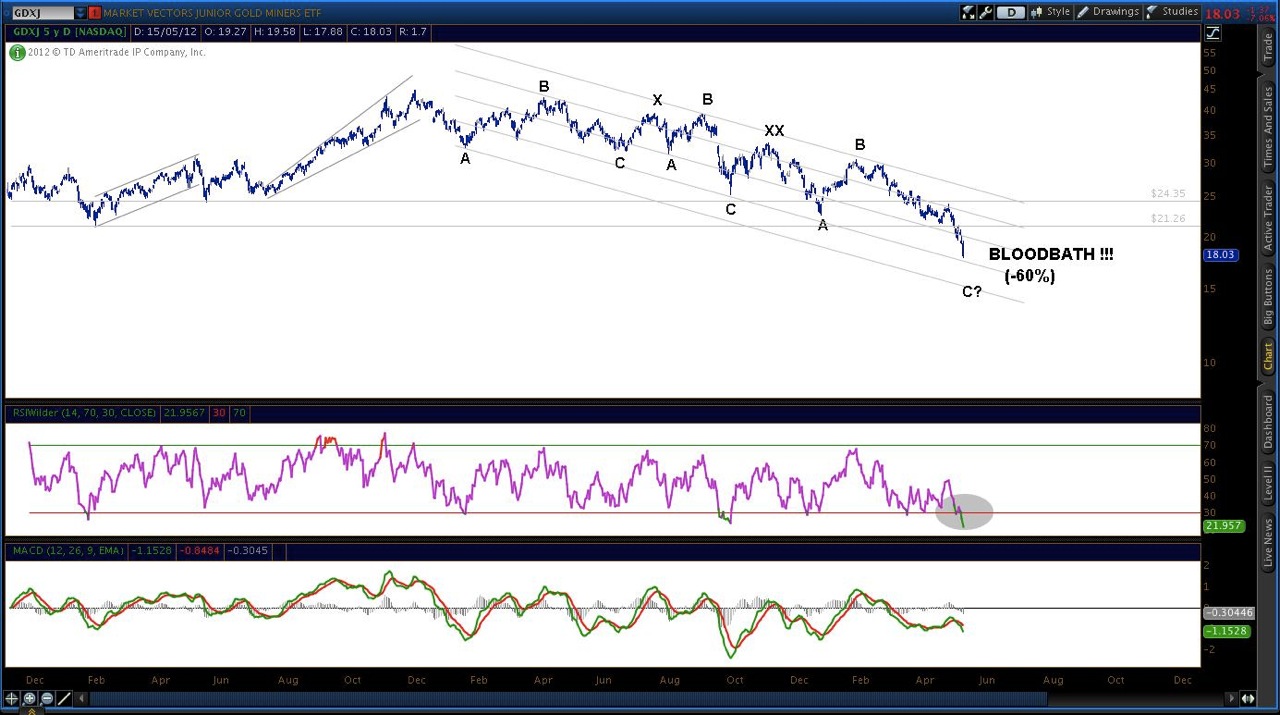
Precious Metals Mining on Sale

A "historic buying opportunity" keeps getting better, but I wonder where the mining stocks bottom ???

Senior Gold Miners ETF


Silver Miners ETF


Junior Gold Miners ETF