S&P 500 at channel and trendline support since
Eurozone ETF (USD) - since 2008 topEMERGING MARKETS (USD) ETFCHINA LARGE CAP (USD) ETFUSD JPY
Tuesday, January 28, 2014
Several Risk markets at technical support levels


Saturday, December 14, 2013
Platinum at a significant support level
Trade away from $1360 ... buy a rally from channel support, sell a break.

Sunday, December 1, 2013
OEW count (alternate take)
A good weekend update by Tony Caldaro's OEW group is posted here: http://caldaro.wordpress.com/2013/11/30/weekend-update-425/
My take on the OEW impulsive count on the Dow is below. Ignore the implications of a higher degree due to the labeling - it doesn't mean anything in my chart.
The modification I have made is to provide for alternation between waves 2 and 4. An Irregular Flat 4 indicates that the uptrend's momentum is strong, and that wave 5 will not be weak and truncated (already confirmed).
A similar count in the SPX has an Irregular Triangle instead of an Irregular Flat

Wednesday, October 9, 2013
GLD at top of declining channel
The decline from 137.5 peak in August is best counted as a corrective Double Zig-Zag (abc-x-abc) with the last declining "c" leg yet to unfold. TheWe are now at the top of the declining channel. If the top rail acts as a resistance we should see an impulsive decline. Support come in around 120 from the longer-term bear flag.

Wednesday, October 2, 2013

Friday, September 27, 2013
Inflation Expectations and the TIP/TLT ratio
The ratio of ETFs TIP &TLT forms a useful inflation barometer.
During the deflation scare of 2008 TIP under-performed TLT. The initial QE rounds resulted in a reflation that led to heightened inflation expectations.
However since mid-2011 inflation expectations have cooled off. TLT has been in a downtrend channel relative to TIP starting with a sharp decline, and followed by a long consolidation.
Now this ratio is in a resistance area defined by previous levels and at the top of a downtrend channel. A renewed decline from here would put pressure on inflation trades - Gold, EM, miners, banks, etc.
A breakout would be a very interesting surprise, given the shrinking effectiveness of the QE measures in stoking inflation expectations.

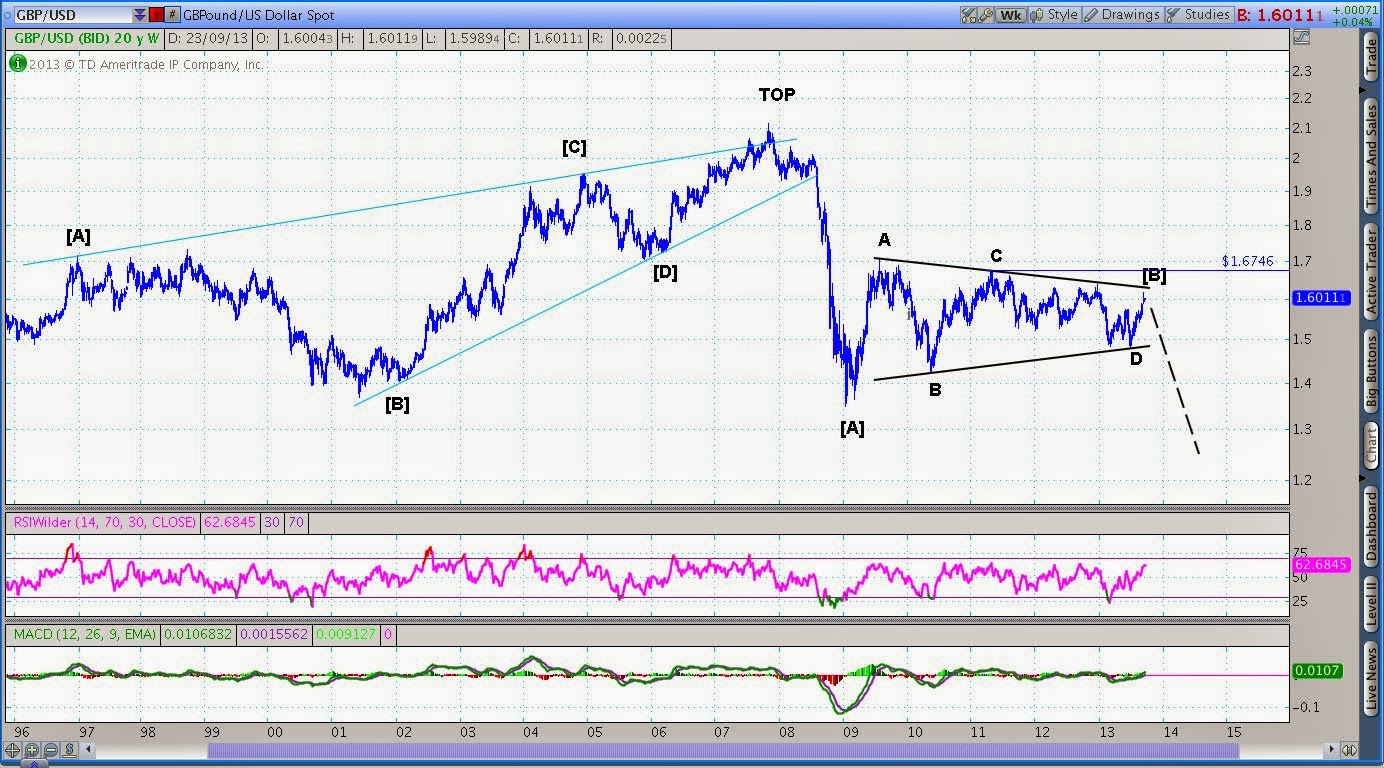
Sunday, September 22, 2013
GBP/USD Triangle projects a decline to 1.25, stop at 1.6746
A Symmetrical Triangle in GBP/USD has meandered its way to completion over 5 years. A decline to 1.25 is projected here. Wrong above 1.6746.
Subscribe to:
Posts (Atom)