Monday, January 16, 2012

Silver -the end (of the bear market) is nigh!!

Looks like Silver is quite oversold - almost as bad as 2008 on the weekly RSI. The MACD is ready to give a long-term buy signal as well.

Following the breakout at $20, silver sped to complete powerful wave (3) advance that terminated at its 1980(!!) high of $50. It has lost up to 50% of the price in the subsequent correction. Two wave counts for the correction are plotted on the chart below, both of which show the market bottoming in wave (4).

The main count in RED has a Diagonal Triangle as the c wave of an a-b-c correction. This would complete wave (4) shortly - likely making a marginal new low, and result in a powerful advance once that occurs.

The second count in GREEN is a Double zig-zag (abc-x-abc). This would probably bottom a little lower than the previous count but should stay above the $20 level to remain valid.


Monday, January 9, 2012

30 YR Bond Futures

Remember that long-bond prices peaked 3 months *before* the stock market bottom. In fact bonds made a lower high in March 2009 when the bull market kicked off. 

More recently, the rally that began in early 2011 from the Pink long-term support line (marked wave B) is fairly mature. However, a 5th and final wave for bond prices is still on the cards.

Such a rally can be quite sharp and bond prices could spike into the 160s, taking them close to the purple projection line.

Support is at $135 at the green trend-line. Breaking below that would be bearish.


Gold sitting below significant resistance

Gold is sitting just below some pretty significant resistance. 
Odds favour another move down unless Gold can clear $1667.3 (in Green). 
A close above $1667.5  would eliminate the impulsive count which will otherwise take the market to the low $1400s.

Resistance is seen from:
  • 200 day moving average (in Blue)
  • Top of the Downtrend channel (in Red)
  • Previous high at $1645.5 (also in Red)
  • Downtrend on the RSI indicator (below price chart)
  • Pink trend-line for the 3 year uptrend that began in late 2008 (recently broken - retest & fail?)


Sunday, January 8, 2012

SPX: Elliott Wave roundup

(charts borrowed from some blogs that I follow)

Base Scenario: Rally Continues

  • My main scenario (60% probability) is for the rally in US markets from the March 2009 low to continue after the break in 2011
  • The economic numbers are slowly recovering in the US and growth is positive
  • Any easing of war tensions in the Iran should take oil prices down, providing additional spending power to consumers
  • Any additional relief to distressed European Sovereigns and Financials should lift the pall of gloom over potential European exposure in US financials
  • Most likely we are going to see another minor correction and then accelerate into a third wave that will launch the next leg up of this Primary bull market


Alt Scenario 1: Imminent Return of the Bear Market
  • Most Elliott-Wave sites now seem to have this count as their main count
  • Summer 2011 correction was an initial leg down (1 or A)
  • We are in a counter-trend bounce (2 or B) that should complete around SPX 1300-1350 (See Scenarios 1a and 1b after this)
  • A sharp C or 3rd wave down is imminent and should be quite severe
  • Short-term: Topping
  • Medium Term: Bearish


Scenario 1a: Ending Diagonal into SPX 1300+-25
  • This is the most likely way Scenario 1 will play out 
  • We are in a multi-month ABC wave since the October lows 
  • The C wave started in December and is forming a "rising wedge" or Ending Diagonal
  • Once complete, this should result in a quick reversal to 1150
  • Wave 5 should be smaller than wave 3 (currently wave 3 seems to have completed at 80 points)
  • Short-Term: Topping
  • Medium-Term: Bearish


Scenario 1b: Triple Combination into SPX 1300-1325
  • Very similar to Scenario 1a in outcome but slightly different in structure
  • We are in a wave C of a multi-month  A-B-C from the October bottom (marked in RED below)
  • The RED C wave began in late December and sub-divides into an ABC marked in BLUE
  • We are in the BLUE minor 'C' subdivision of the larger RED C wave 
  • Short-Term: Topping
  • Medium-Term: Bearish


Scenario 2: Double Zig-Zag from the March 2009 lows
  • This would behave very similar to the Base Scenario - a rally over the next few months
  • We need to see acceleration with a clear impulsive structure for C
  • 1440 is a good target for this scenario as it is the extreme of the B wave in 2008
  • Once C wave completes, it would be followed by a severe bear market 
  • Medium-Term: Bullish
  • Long-Term: Bearish

Friday, December 23, 2011

WTI crude bear setup


A happy holiday season and best wishes for 2012 to all readers. Here is a possible bearish setup for WTI crude oil futures.

Background
  • Multi-year pattern since 1998 appears to be a Expanding Triangle
  • Wave (V) of the Expanding Triangle started in 2009 after the big commodities sell-off in 2008
  • The initial move took WTI Crude from $33 to $114 – this is marked as wave A
  • Wave A was retraced 50% - this is marked as wave (a)

Setup
  • In the current setup wave (b) has retraces more than 61.8% of wave (a) as it approaches the wave A extreme
  • Given the outlook for a slowdown, especially in in BRICs and Europe, we could now see weakness over the next 6 months to complete wave B
  • Target for this move is the $65 area, where (a) = (c)
  • Here wave B retraces A by the Fibbonacci 61.8%
  • The forecast would be wrong (or too early) if the price rises above the recent top at $103.5


15 YR WEEKLY 

3 YR DAILY


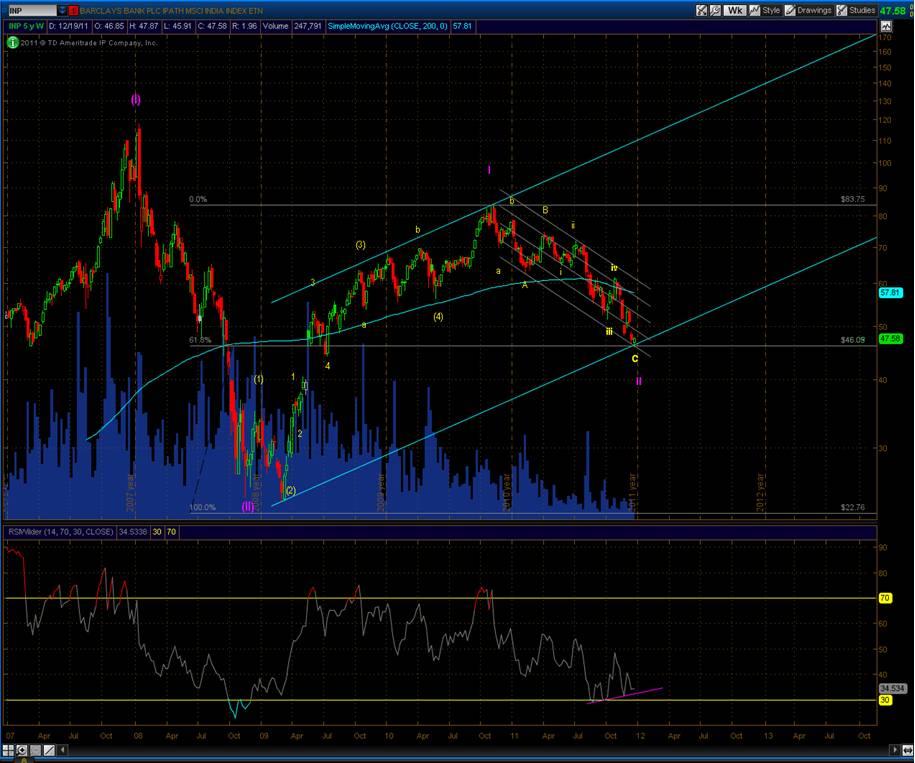
SENSEX completes 61.8% correction


Keeping an unbiased approach means keeping track of alternate counts. In case the 2008 correction was a wave (II), we are in the area of a 61.8% retracement of the recovery rally.

IF the alternate count works out (the developing H&S patterns would have to be aborted), THEN positive divergence on the RSI makes it a fairly good place to start a rally.

Wait for confirmation in price – a higher low is required. I wouldn’t jump in with both feet quite yet.


NOTE: The count below uses a USD denominated ETF (INP). The Rupee denominated SENSEX has not yet retraced 61.8% but the above argument can be applied once it does so. 

Thursday, November 3, 2011

SPX second test of Triple Resistance

Having bumped up against formidable triple resistance - the 200 day moving average, the neckline of the H&S pattern, and the downtrend - the market is lining up for another test of the resistance area. This is the first serious challenge to the October rally. The next few days should prove clues to the subsequent market direction.  I am not biased towards either direction here as the market has worked off its oversold condition and is sitting just below significant resistance.