Thursday, October 25, 2012
Thursday, October 11, 2012
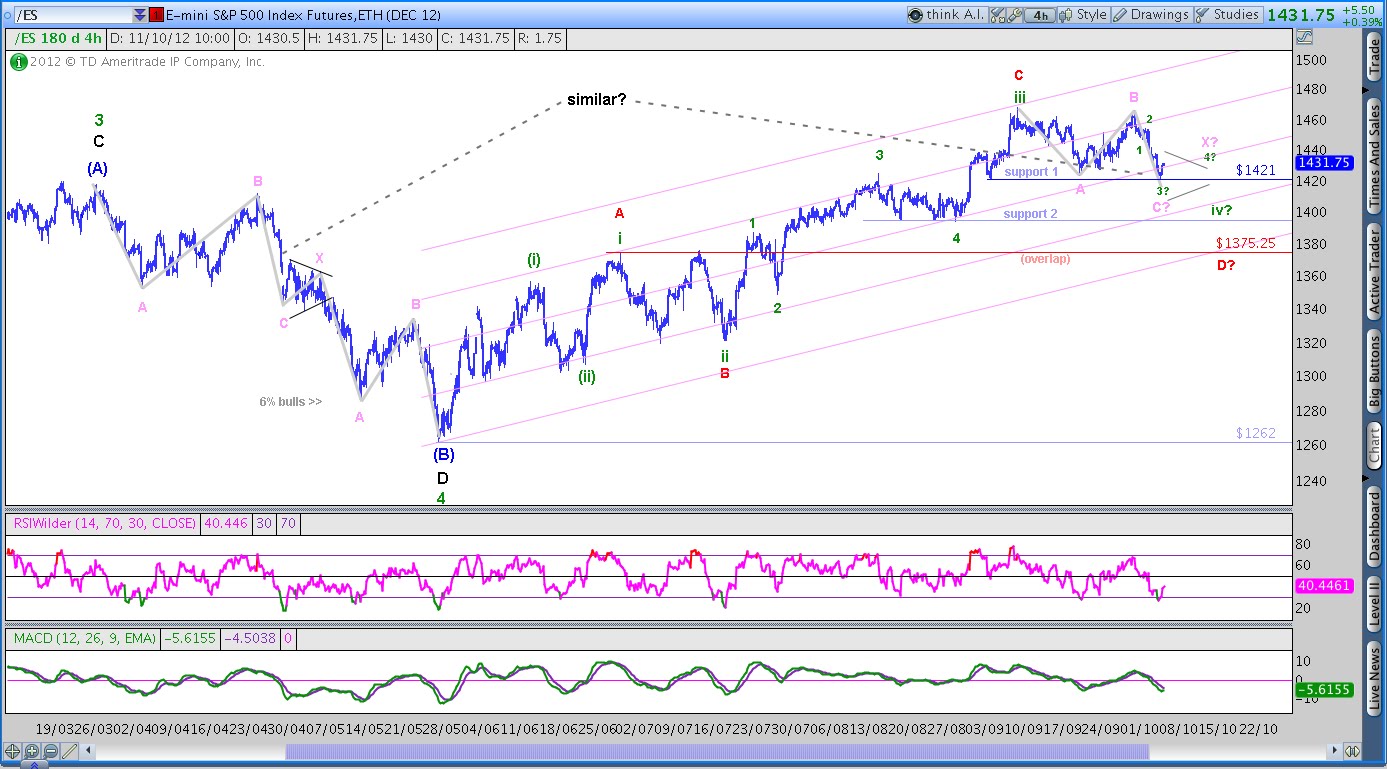
SPX Flat pattern similar to March 2012
Subscribers to our daily updates expected a sharp decline in wave C and the market has certainly not disappointed! A substantial portion (or maybe all) of the wave C decline is complete. It is now worth pointing out the similarity between the current Elliott Wave Flat pattern, and the one that unfolded in March 2012.
In March, the initial ABC unfolded as expected. After that the most likely possibility was a resumption of the bull market with an impulsive advance. However, the market failed to rally. Instead it put in a small, Triangular 'X' wave ('X' means AND in EW-speak), followed by a second ABC down to complete a Double Combination to 1262.
I am not saying that this is exactly what will happen this time as well. This time we may just get the one ABC. However the pattern has been eerily similar so far so readers should stay alert for the possibility of a deeper correction.
Tuesday, October 9, 2012
AUD/USD correction likely to accelerate
Growth concerns are mounting in Australia. As the housing market looks increasingly shaky, businesses are failing in droves. Weaker economic growth should lead to lower long-term rates. I expect weakness in the currency as capital flows out of the country, or as foreign investors in illiquid Australian investments hedge their currency risks.
Looking at the long term NEoWave pattern for AUD/USD there is a case for a correction to around 0.80. Regardless of whether you count the advance from 2009 as an Impulse or a Double Combination, the advance needs to be corrected. Targets for the correction range from 0.90 down to 0.80. Stops can be placed at 1.0612.
Long-term puts on ETF FXA can be used to short this currency pair. Professional Investors may consider buying long-term Australian Government Bond Futures in anticipation of lower long-term rates.
Looking at the long term NEoWave pattern for AUD/USD there is a case for a correction to around 0.80. Regardless of whether you count the advance from 2009 as an Impulse or a Double Combination, the advance needs to be corrected. Targets for the correction range from 0.90 down to 0.80. Stops can be placed at 1.0612.
Long-term puts on ETF FXA can be used to short this currency pair. Professional Investors may consider buying long-term Australian Government Bond Futures in anticipation of lower long-term rates.
Monday, October 8, 2012
Elliott Wave Technical Analysis Report for Oct 01, 2012
Please find a link below to the Daily Update sent out to subscribers on Oct 1, 2012. Visit www.damarlaconsulting.com for information on how to receive these reports on a daily basis.
Elliott Wave Technical Analysis Report for Oct 01, 2012
Monday, October 1, 2012
Elliott Wave Technical Analysis Report for Sept 24
This Daily Update was sent out to subscribers on Sept 24, 2012. Visit www.damarlaconsulting.com for information on how to receive these reports on a daily basis.
Elliott Wave Technical Analysis Report for Sept 24, 2012
Friday, August 24, 2012
Gold retesting top of the consolidation channel
Gold is at a crucial pivot level between bear and bull outcomes. Daily RSI is overbought enough to call for a short-term correction here.
Gold Bears want to see Gold fail below the upper trend-line of the year-old bear channel/bull-flag/consolidation, below 1675-80. Bearish counts in Blue and Red target new lows that range anywhere from 1490 down to the 1300s.
Gold Bulls want to see continuation of the persistent impulsive rise with short, shallow pullbacks. A possible bullish wave-count is shown in Black with wave E marking the last leg of an ABCDE wave (4) consolidation from last year's blow-off top (unlikely below 1592.1). An alternate bullish count in Grey requires a retest of the 1525 lows as wave 'c'.
Previous analysis and charts
9 Feb 2012: Gold's downtrend channel asserts itself
9 Jan 2012: Gold sitting below significant resistance
25 Aug 2011: Gold corrects at channel top - wave (IV) underway
9 Aug 2011: Gold at multi-year channel resistance
3 Aug 2011: There's No Fever Like Gold Fever
4 Nov 2009: Gold inflexion point at 1115
Saturday, August 11, 2012
Gold medium term wave-counts
The blow-off top in 2011 started a correction that has lasted almost a year now. For the past few months Gold has been stuck in a slowly-contracting trading range between 1525 and 1642.
To end the correction from 1900, Gold needs to rally above 1800, where it has failed twice. But first it needs to break out of the Red descending channel.
An impulsive rise that achieves a weekly close above the 1670-75 area (December Future) is needed to avert a continued decline. A possible bullish wave-count is shown in the chart below to support this scenario.
If a sharp decline is seen close to the upper channel boundary (similar to what happened after the end of wave D), we risk a further decline to 1480-90, or even lower to the channel base at 1300-1325 (both 4th waves of lower degrees).
Gold Dec Future Daily (3 years)
A bullish wave-count in which Gold is ready to rally is shown in BLACK below. Too early if below 1585. Wrong below 1550.
A bearish wave-count shows wave C extending lower towards 1480-90 or 1300-25 (depending on where wave B ends). Unlikely above 1575.
Subscribe to:
Posts (Atom)