Monday, January 9, 2012

Gold sitting below significant resistance

Gold is sitting just below some pretty significant resistance. 
Odds favour another move down unless Gold can clear $1667.3 (in Green). 
A close above $1667.5  would eliminate the impulsive count which will otherwise take the market to the low $1400s.

Resistance is seen from:
  • 200 day moving average (in Blue)
  • Top of the Downtrend channel (in Red)
  • Previous high at $1645.5 (also in Red)
  • Downtrend on the RSI indicator (below price chart)
  • Pink trend-line for the 3 year uptrend that began in late 2008 (recently broken - retest & fail?)


Sunday, January 8, 2012

SPX: Elliott Wave roundup

(charts borrowed from some blogs that I follow)

Base Scenario: Rally Continues

  • My main scenario (60% probability) is for the rally in US markets from the March 2009 low to continue after the break in 2011
  • The economic numbers are slowly recovering in the US and growth is positive
  • Any easing of war tensions in the Iran should take oil prices down, providing additional spending power to consumers
  • Any additional relief to distressed European Sovereigns and Financials should lift the pall of gloom over potential European exposure in US financials
  • Most likely we are going to see another minor correction and then accelerate into a third wave that will launch the next leg up of this Primary bull market


Alt Scenario 1: Imminent Return of the Bear Market
  • Most Elliott-Wave sites now seem to have this count as their main count
  • Summer 2011 correction was an initial leg down (1 or A)
  • We are in a counter-trend bounce (2 or B) that should complete around SPX 1300-1350 (See Scenarios 1a and 1b after this)
  • A sharp C or 3rd wave down is imminent and should be quite severe
  • Short-term: Topping
  • Medium Term: Bearish


Scenario 1a: Ending Diagonal into SPX 1300+-25
  • This is the most likely way Scenario 1 will play out 
  • We are in a multi-month ABC wave since the October lows 
  • The C wave started in December and is forming a "rising wedge" or Ending Diagonal
  • Once complete, this should result in a quick reversal to 1150
  • Wave 5 should be smaller than wave 3 (currently wave 3 seems to have completed at 80 points)
  • Short-Term: Topping
  • Medium-Term: Bearish


Scenario 1b: Triple Combination into SPX 1300-1325
  • Very similar to Scenario 1a in outcome but slightly different in structure
  • We are in a wave C of a multi-month  A-B-C from the October bottom (marked in RED below)
  • The RED C wave began in late December and sub-divides into an ABC marked in BLUE
  • We are in the BLUE minor 'C' subdivision of the larger RED C wave 
  • Short-Term: Topping
  • Medium-Term: Bearish


Scenario 2: Double Zig-Zag from the March 2009 lows
  • This would behave very similar to the Base Scenario - a rally over the next few months
  • We need to see acceleration with a clear impulsive structure for C
  • 1440 is a good target for this scenario as it is the extreme of the B wave in 2008
  • Once C wave completes, it would be followed by a severe bear market 
  • Medium-Term: Bullish
  • Long-Term: Bearish

Friday, December 23, 2011

WTI crude bear setup


A happy holiday season and best wishes for 2012 to all readers. Here is a possible bearish setup for WTI crude oil futures.

Background
  • Multi-year pattern since 1998 appears to be a Expanding Triangle
  • Wave (V) of the Expanding Triangle started in 2009 after the big commodities sell-off in 2008
  • The initial move took WTI Crude from $33 to $114 – this is marked as wave A
  • Wave A was retraced 50% - this is marked as wave (a)

Setup
  • In the current setup wave (b) has retraces more than 61.8% of wave (a) as it approaches the wave A extreme
  • Given the outlook for a slowdown, especially in in BRICs and Europe, we could now see weakness over the next 6 months to complete wave B
  • Target for this move is the $65 area, where (a) = (c)
  • Here wave B retraces A by the Fibbonacci 61.8%
  • The forecast would be wrong (or too early) if the price rises above the recent top at $103.5


15 YR WEEKLY 

3 YR DAILY


SENSEX completes 61.8% correction


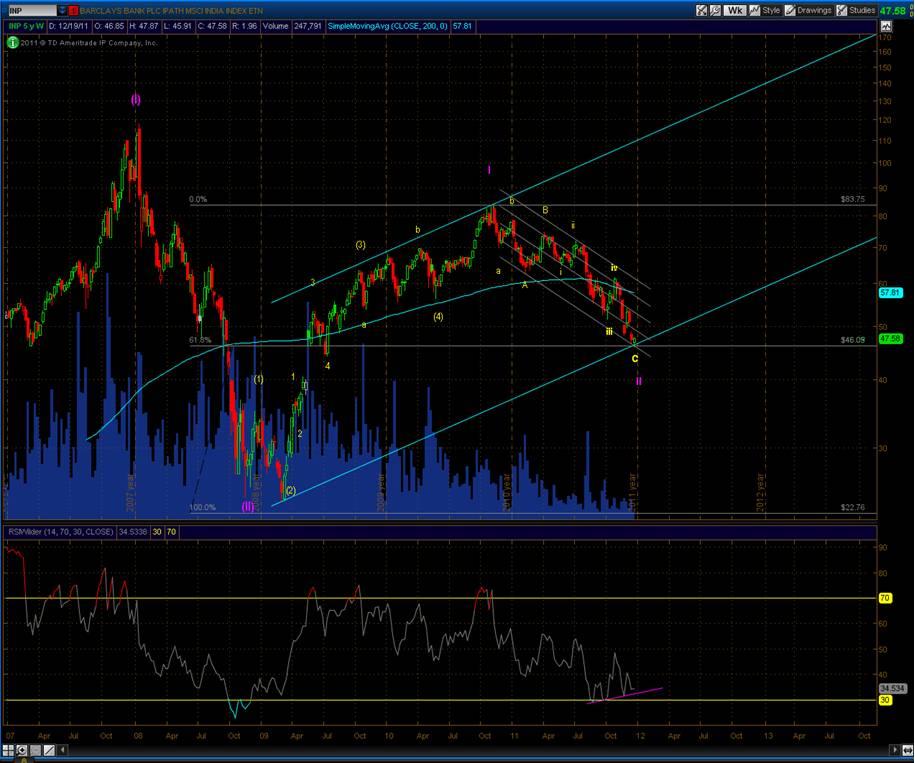
Keeping an unbiased approach means keeping track of alternate counts. In case the 2008 correction was a wave (II), we are in the area of a 61.8% retracement of the recovery rally.

IF the alternate count works out (the developing H&S patterns would have to be aborted), THEN positive divergence on the RSI makes it a fairly good place to start a rally.

Wait for confirmation in price – a higher low is required. I wouldn’t jump in with both feet quite yet.


NOTE: The count below uses a USD denominated ETF (INP). The Rupee denominated SENSEX has not yet retraced 61.8% but the above argument can be applied once it does so. 

Thursday, November 3, 2011

SPX second test of Triple Resistance

Having bumped up against formidable triple resistance - the 200 day moving average, the neckline of the H&S pattern, and the downtrend - the market is lining up for another test of the resistance area. This is the first serious challenge to the October rally. The next few days should prove clues to the subsequent market direction.  I am not biased towards either direction here as the market has worked off its oversold condition and is sitting just below significant resistance.


Thursday, October 27, 2011

Dollar Index - Downtrend remains In Force


DX was soundly rejected by a combination of the PIVOT at 80, the 200 DMA and the upper boundary of the Pitchfork.

For now the onus is on the DX bulls – they need to prove this is not just a temporary setback in retaking the 80 level within a short timeframe.

As discussed earlier, the Dollar downtrend remains in force until it can work its way over the 80 level.

The Elliott wave count below portends some very bearish outcomes for the Dollar. Wave 3 of (3) of III will send the Dollar plummeting and Risk assets rising, if Dollar bulls cannot get their act together.

Charts - Framing the Markets

A falling dollar index, if it breaks below 72.5 ….

 
…. could provide SPX with the needed impetus to clear the resistance zone (1275 to 1350) formed by the 200 DMA, H&S neckline and downtrend channel resistance
 
Could we be on the launch pad for III of (III) for SPX? Stay tuned ….
-----------------------------------------------------------------------------------------------------------


From: Friday, October 14, 2011
Dollar Index Technicals

For the bull case targeting 100:
  •  The TENTATIVE uptrend channel in GREEN needs to hold
  • DX needs to close ABOVE the 80 pivot line in BLUE
  • For this move to be anything other than a correction of the downtrend established last year, DX needs to get ABOVE Andrew pitchfork in RED (again, around 80)
  • Then it needs to break ABOVE the GREY downtrend channel to get seriously bullish

The action around the 80 pivot line could continue in a multi-year contracting triangle, reflecting the alternating concerns between the finances of the US and the Eurozone sovereigns.


Monday, October 17, 2011

Not a market to get comfortable in

There is near universal agreement that the sharp rally from the marginal new low has been breathtaking. And that it marks the beginning of a correction. The first phase down of the bear market is over. 

Many are convinced that they expect this phase to retrace 50% or 62% of the first phase of the bear market - drawing parallels with the first phase of the declines in 2000 and in 2008. 

Elliott Wave Counts are rarely decisive - except in retrospect. In times of market volatility such as now it is common for us to latch on to one count and trade with a bias. 

This short squeeze has caught many flat-footed. Doubtless, several were convinced that we were breaking decisively below the summer range. A volatile 1100-1230 range has been in force since I called for an end to the summer panic here in August.  


Back then I had labelled the August low as a wave (ii). I would now move wave (ii) to the marginal low at 1075 as below.


Do I really think we just saw a wave (ii) low? Maybe. I know of hardly anyone who expects a major bull market to unfold right now. That in itself is a strong contrarian argument in its favour. We could be climbing the proverbial wall of worry in a powerful wave 3. It may sound unbelievable, but it is possible. In fact I can count a bull market at least 3 different ways from here. The question is not whether it will happen, rather if the market keeps rallying, are you prepared?

So am I ruling out a continuation of the bear market? Of course not.

To most people the B wave began on October 4th. Yes, I agree. It most likely did. 

But it could have begun on crash low on August 9th. Or on August 22nd with a truncated minor wave 'v'. In either case of the two cases we could now be almost done with (c) of B. That means a devastating C wave is just around the corner, ready to surprise those hoping to play a  multi-week countertrend rally. If the market suddenly turns on a dime and craters here, are you prepared?

Or maybe the wave that completed on October 4th was W, and not A. That means we are in a short, sharp X wave that threatens to end anytime now. How many people mentally expect a languid multi-week rebound of the sorts we saw in December 2000 and March 2008? Are you mentally prepared for a Y wave to unfold here?


Let us be clear - this market does NOT have a favoured Elliott Wave count right now. All above possibilities are still on the table. A sharp reversal breaking below 1075 means a multi-week wave B or wave 2 is not likely. Breaking below 1000 will negate the bullish wave 3 count. Let the market decide. Be prepared. 

Arvind


PS: I urge you to read a really good post on the similarities with previous bear market rallies here.