Tuesday, May 29, 2012

Dollar Index faces significant test

Last month's rapid EUR decline has brought the Dollar index up against a significant trendline stretching back 11 years. Chances are we will get a reaction here. 

If DX slices through this level, the next attraction is the 88/90 area (previous peaks from the 2008 crash & Summer 2010 Euro-to-zero fears).

Sunday, May 20, 2012

SPX Special Update

SPX touched a low of 1291.98 on Friday. This overlaps with the October 2011 high of 1292.66. 
  • Just below us is the crucial Dec 2011 high at 1267.07. Breaking below this has major structural implications.
  • IF SPX trades below 1267.07, I will be forced to mark the advance from the Dec 2011 low as (a)-(b)-1-2-3-4-C (see chart below); instead of current (1)-(2)-1-2-3-4-(3)-(a)-(b)-(4)-(5) count (not shown) 

It is NOT A GIVEN that we will get down to 1267.07. Reasons this may not happen are:
  • There is EXTREME bearishness, while the market is down only 9% from recent highs
  • This is more likely the sign of a short-term PANIC, than the beginning of a bear market
  • We dropped to 6% bulls on the Daily Sentiment Index for SPX on Friday. This is close to the 4% level we have seen for previous panic lows.
  • Daily RSI is deeply oversold - LOWER than Mar 2009; and almost as low as Oct 2008
  • Channel support from March 2009

BOTTOM LINE 
  • Dropping only 28 points from here will change the MEDIUM-TERM structure of the market. Stay alert for the possibility that we dip below 1267.07 before the upcoming oversold rally.
  • Yes, the market may crash but NO ONE can tell you that BEFORE it happens. I wouldn't stay short a market with only 6% bulls and a deeply oversold Daily RSI


NEW SPX count IF we trade BELOW 1267.07 (MEDIUM TERM)


NEW SPX count IF we trade BELOW 1267.07 (SHORT TERM alternate)


Wednesday, May 16, 2012

SIlver at pivot level

We are near support @  26.3 from the Ascending Channel and Previous Lows. Breaking below would activate a Head & Shoulders pattern leading to a steep decline towards 20 / 21.6.

NDX near channel support and 38.2% retracement

A good spot to find support and rally in wave (v). Daily RSI getting to oversold to levels. Only lower in Oct 2008 and in the 2011 panic.

Definitely the strongest looking of all the major US indices.


Tuesday, May 15, 2012

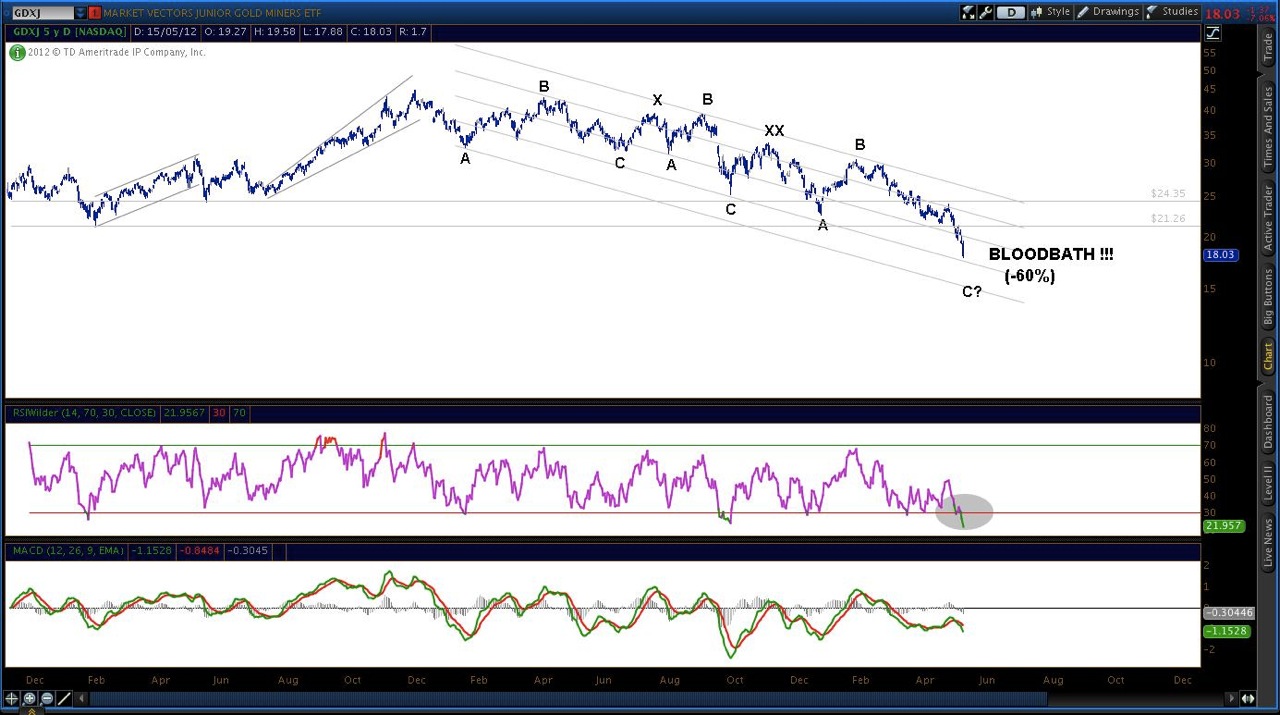
Precious Metals Mining on Sale

A "historic buying opportunity" keeps getting better, but I wonder where the mining stocks bottom ???

Senior Gold Miners ETF


Silver Miners ETF


Junior Gold Miners ETF


Wednesday, May 9, 2012

SPX Update 2012-05-09

See Previous update here.

A Flat a-b-c correction for wave (4) alternates nicely with the sharper and deeper wave (2). Wave (4) has done enough to count as completed, and if so, we should now see a move to 1440 or 1510 in wave (5). Clearing potential resistance levels at 1375, 1390 and 1400 provides increasing confidence in this scenario. Wave (4) may also evolve into a more complex correction so we will keep an eye out for that.

An alternate count is presented for the bears. It calls for a weak corrective bounce followed by an impulsive break below recent lows. However, I wouldn’t bet on it in the face of any rise above 1400.


Crude Oil Update 2012-05-09

If the a-b-c decline from $110 is complete, we may have formed wave d of a Contracting Triangle with Reverse Alternation (BROWN). In Contracting Triangles a < c < e. In normal alternation b > d, which gives us a familiar contracting shape. However in reverse alternation b < d. Note that wave c of a triangle cannot be the shortest, capping wave e at $114.12. Wave e is 0.618 * wave c, at around $107. Declining below $92.5 would call this scenario into question.