Wednesday, November 4, 2009

Gold inflexion point at 1115


Last stop for impulse count out of triangle is 1115 where wave 3 could become the shortest of the 5 waves. This is a critical spot.

After that we would have to consider the move off $680 to be an impulse with a series of very bullish 1-2-1-2s and see then we should see much higher highs.

Although gold is looking extremely bullish right now, the divergence created by no new highs in gold miners (GDX) and silver (SLV) makes me worry that this is a blowoff top.

Monday, October 5, 2009

The case for one more high

Complex correction upwards on the SPX


Much simpler wedge pattern on the DOW. When it breaks the lower trendline, look for a kissback and down she goes!
Friday, September 4, 2009

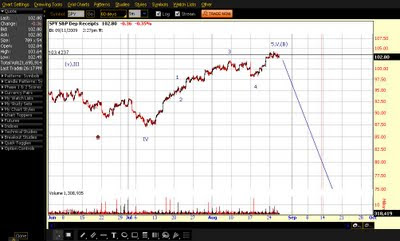
SPX decline not impulsive - needs another high

Dollar needs another low so its likely that SPX & EUR need another high

SPX:


DX:


DX short term:


EUR Long Term:


EUR short term:

Wednesday, September 2, 2009

Wednesday, August 26, 2009

Saturday, June 13, 2009

Critical NatGas level - 1-2-1-2 or triangle?


Natgas looks like it could have completed a 4th wave triangle just inside of the multi-month downward channel. A break outside the channel would be very bullish. However there is a compelling count that suggests a sharp thrust downwards to complete the 5th wave. Use stops at UNG 13.25 if long & reduce positions to limit losses in case of a stee drop!!

Wednesday, June 3, 2009

Natural Gas (1)-(2)-1-2


Very good RR here. If the main (blue) count is wrong, it has to break the previous low. Expect a reversal at the 78.6% retracement. Prepare to load up - stops at UNG 13.25!!

Monday, May 25, 2009

GDX gold miner's ETF has a breakout


GDX did not make new lows with the broader stock market in March.

It has now broken above the descending trendline with bullish Cup and Handle & inverted Head and Shoulders (H&S) patterns.

The EW count is also bullish for a further upside. It has been a great run up for this ETF from a low of 15.5 and is likely to continue at least till at least 55 based on the initial H&S target.

However, if Gold and the broader markets turns lower we may see a de-leveraging (C) wave to complete wave IV (green count).

The more bullish alternative is that wave IV was in at 15.5 and that we will see much higher prices soon. However, this seems less likely due to the impending correction in gold and in the broader markets.


Saturday, May 9, 2009

Long Bonds deteriorate rapidly

Long bond futures accelerating downwards for now. A possible count shown below, but we may also have (i)-(ii)-i-ii-1-2 here. Very bearish looking chart indeed.


Natural Gas Update

Pretty textbook impulse. c or 3rd wave in progress. Let's see how far it goes.


Great Indian Bull Market

India ETF showing clear impulsive rise from March.

Also the correction from the top seems a 3 wave affair rather than 5 five waves. The October 2008 low was not lost this year.

This clearly indicates that a bull market seems to have begun and we are in wave (1) of III. A correction seems to be imminent, and a higher low would be confirmation of this. That would be a great time for long term bull market trade.


Wednesday, May 6, 2009

Natural Gas Update


Three possibilities:
1. Wave (5) & C is complete
2. Expanded flat wave 4 (not shown)
3. Expanded flat wave (4)

Sunday, April 19, 2009

Big bear rally update


A few possible bullish counts for a big bear rally to continue - i.e. no new lows on the SPX in the near future.


Blog Archive