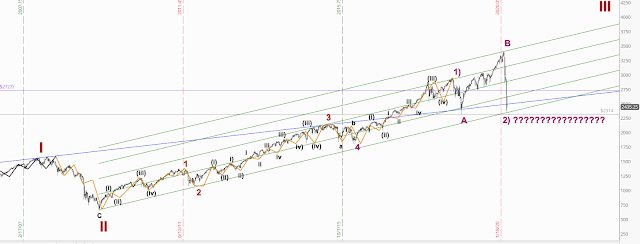
Elliott Wave Counts
Tuesday, March 17, 2020
Saturday, January 24, 2015
Case of an end to the Euro Decline
Macro View
As one might expect, the Euro has sold off on the announcement of a EUR 1 Trillion Quantitative Easing program. National Central Banks will purchase EUR 60 billion worth of their respective governments' debt, in amounts proportional to their capital key in the ECB. The stated purpose of this program is to fight deflation.
Central Banks will earn interest on the debt they purchase. This interest will flow back to the Euro-area governments. This mechanism is already in place in the US and the UK. The Fed/BoE pay the interest received on QE holdings back to the government (minus costs and interest paid to banks on excess reserves). Effectively these governments will obtain interest free financing on the QE purchases.
A monthly decrease in interest payments will gradually reduce the pressure to retain austerity policies. Greater government spending will stimulate peripheral economies, and help unblock the transmission mechanism of ECB monetary policy.
Capital that previously fled the Euro area in fear should begin to return home as sovereign financial distress eases. If these capital flows materialise as expected they should arrest the decline of the Euro.
Technical View
The EUR/USD and EUR/GBP pairs have been in well-channeled corrective declines since the 2008 tops. In Elliott Wave terms both pairs appear to be in a Double Zig-Zag corrective patterns counted as ABC-X-ABC.
Both pairs are now approaching very long-term ascending channel bases, and the Weekly RSIs are at record lows.
EUR/GBP
My prediction for EUR/GBP in August 2013 calling for a decline from 0.855 to 0.75 has been achieved. See previous post here: http://elliottwavecounts.blogspot.co.uk/2013/08/eurgbp-breaks-below-uptrend-line.html.
EUR/USD
A decline in EUR/USD was identified to the precise date of the top on 8th May 2014 at 1.3899 (see second chart). The measurement for A = C in the second zig-zag implies a low at 1.109. The Euro has traded down to 1.1115, which is good enough for me! An extension of wave C could lead to a drop to parity if the long-term channel does not hold. Trail stops on existing short positions to capture any last spike down.
From: Arvind Damarla
Subject: Fwd: EUR/USD
Date: 8 May 2014 15:22:58 BST
Saturday, October 25, 2014
Inflation Expectations: TIP/TLT ratio
In 2013 inflation expectations were back on the rise after falling sharply in 2011 from the post-2009 reflation. Most people expected the Fed would be able to meet its inflation targets due to steady economic growth. There was even talk of rate rises without a deflationary impact.
However, a calm look at the charts showed that this was just a wave B consolidation in the "inflation" bear market that has been in effect since 2011. See my previous post from Sept 2013 here: http://elliottwavecounts.blogspot.co.uk/2013/09/inflation-expectations-and-tiptlt-ratio.html
However, a calm look at the charts showed that this was just a wave B consolidation in the "inflation" bear market that has been in effect since 2011. See my previous post from Sept 2013 here: http://elliottwavecounts.blogspot.co.uk/2013/09/inflation-expectations-and-tiptlt-ratio.html
Not surprisingly, the bear market in "inflation" has re-asserted itself and Precious Metals and Miners have sold off. Any nascent expectations of inflation or of rate rises have now evaporated.
The wave-count below suggests that this trend still has some way to go, and could easily continue into the late 2015 ECM turn date.
Friday, April 4, 2014
USD view of Emerging Markets
EEM: MSCI Emerging Markets (USD)
Despite the excitement of the last couple of weeks Emerging markets continue to remain a 4 yr-old contracting range (in USD terms).
Same for the Weekly RSI.
FXI: China Large Caps (USD)
China remains the bellwether market for EM and commodities. Key indicators like AUD, CAD, Copper, will take direction from Chinese demand.
Continues in a pennant formation, which no clear view as to which way it will break.
INP: India (USD) ETF
Indian markets are at new highs in Rupee terms. In dollar terms the SENSEX has done nothing for 4 years.
Now against long-standing resistance with an overbought RSI, the India USD ETF is at risk of an unpleasant correction.
RSX: Russia (USD) ETF
The wave count allows for further lows, but has done enough to be a completed decline. Weekly RSI is pretty oversold.
EWZ: Brazil (USD) ETF
The wave count here too allows for further lows, but when the Falling Wedge breaks this market can fly like a rocket. Weekly RSI showing positive divergence from oversold.
Thursday, February 20, 2014
Tuesday, January 28, 2014
Saturday, December 14, 2013
Subscribe to:
Comments (Atom)


